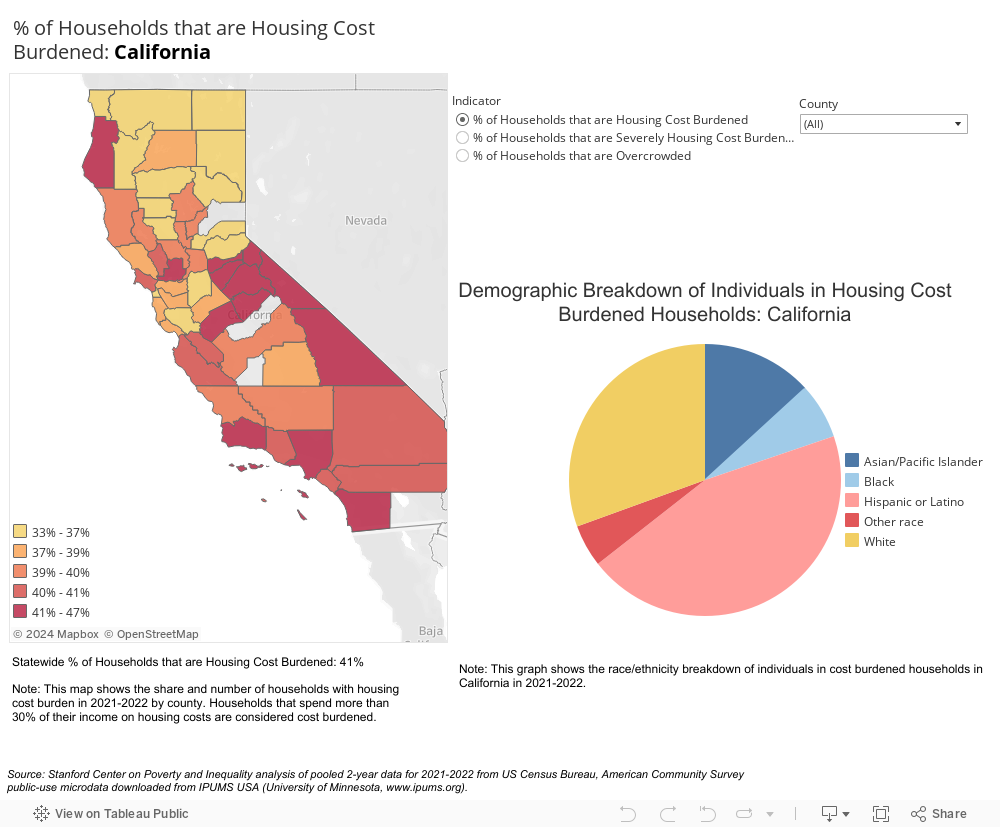
Housing makes up the largest share of the basic needs budget for most families and individuals, and stable housing is an important foundation for positive outcomes in employment, education, and physical and mental well-being. The first two indicators highlighted within this category are the share of housing cost-burdened households – those paying more than 30 percent of household cash income toward housing costs – and the share of severely housing cost-burdened households – those paying more than half of household cash income toward housing costs. It is important to consider overcrowding alongside housing cost burden, because overcrowding within housing units can be a strategy to cope with unaffordable housing costs.
Housing data presented here reflect annual averages for 2021-2022.
A note about comparing county data points to each other, and to statewide data points: California’s 58 counties vary substantially in resident demographics, characteristics of local economies, tax base, community-based organization capacity, and local government administrative capacity. All of these factors can contribute to differences in outcomes across the indicators shown in the dashboard.
Also note that data points estimated from survey data include some uncertainty, reflected in the confidence intervals shown for these data points in the dashboard. Where confidence intervals on a particular indicator overlap for estimates for different counties, or for a county versus the statewide data point, these estimates are often not statistically significantly different from each other.