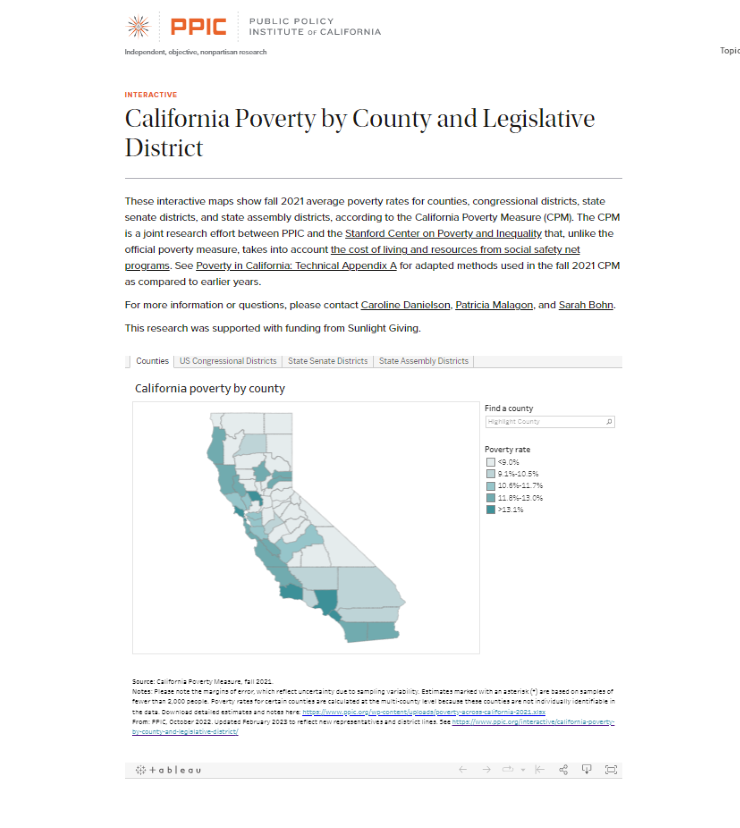
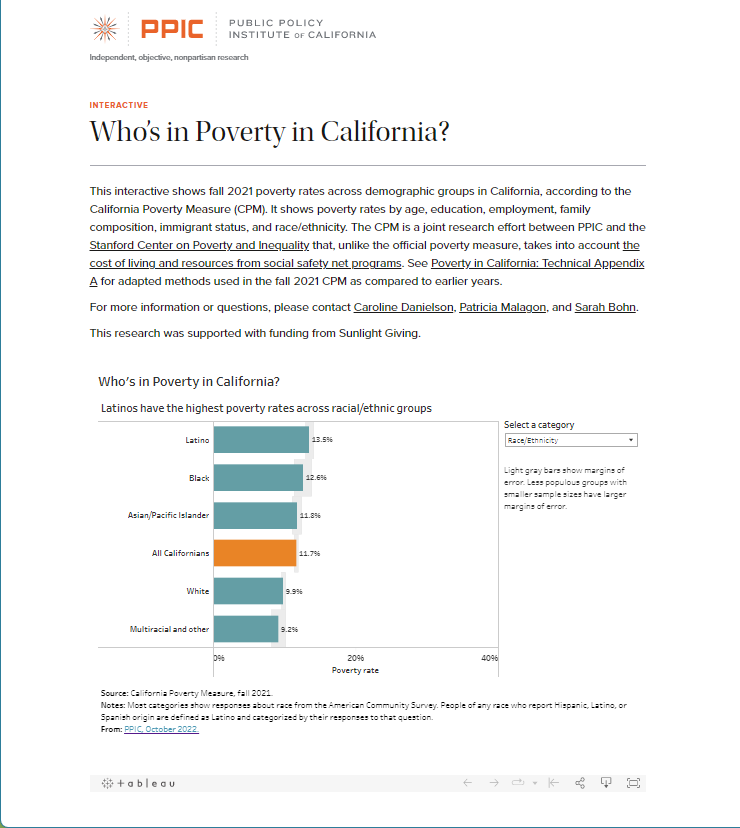
The California Poverty Measure is a state-specific index of poverty, modeled on the Census Bureau's Supplemental Poverty Measure, that improves upon traditional poverty measures. Unlike traditional measures, the CPM accounts for necessary expenditures like child care and out-of-pocket health costs, adjusts for geographic differences in housing costs, and includes tax credits, food assistance, and other non-cash benefits in the resources available to help families meet basic needs. The CPM is jointly produced by the Stanford Center on Poverty and Inequality and the Public Policy Institute of California.
See the complete description of the Center's California Poverty Measure research for more details about this research and additional CPM publications.
CPM Poverty Data for Calendar Year 2023

Access the Latest Data
The latest available California Poverty Measure data are estimates for calendar year 2023, and can be accessed through the PPIC website:
View or download the latest CPM poverty rates for California counties and legislative districts
View or download the latest CPM poverty rates for demographic groups in California
View the latest Poverty in California fact sheet
View the latest Poverty Among California's Workers fact sheet
CPM Poverty Data for 2011 Through 2022
Selected estimates for calendar years 2022 and 2021 are available by request. Estimates for calendar year 2020 were not produced due to pandemic-era data quality issues. Other prior calendar year estimates are available in reports published by the Stanford Center on Poverty and Inequality:
- Read the brief (2021): In 2019, as the Economy Boomed, About 1 in 3 Californians Lived in Poverty or Near Poverty
- Read the brief (2021): More Than 1 in 3 Californians Lived in Poverty or Near Poverty in 2018
- Read the brief (2019): Poverty Declines in California, but More Than 1 in 3 Are Poor or Nearly Poor: 2017
- Read the brief (2018): 2.1 Million Californians in Deep Poverty: 2016
- Read the brief (2017): California’s Poverty Rate Goes Down, but 7.5 Million Remain Poor: 2015
- Read the brief (2018): Trends in California Poverty: 2011–2014
- Read the brief (2014): Poverty and Deep Poverty in California: 2012
- Read the brief (2013): A Portrait of Poverty within California Counties and Demographic Groups: 2011
- Read the report (2013): The California Poverty Measure: A New Look at the Social Safety Net
See the methodology details:
- View the methodology (2017): The California Poverty Measure 2014: Technical Appendices
- View the methodology (2013): The California Poverty Measure 2012: Technical Appendices
Special CPM estimates for Early 2023 and Fall 2021 were produced using an experimental CPM methodology initially developed to address pandemic-related data limitations and to facilitate more current estimates. See the CPM Early 2023 and Fall 2021 methodology details:
- View the methodology (2023): California Poverty Measure Early 2023 and Fall 2021: Technical Appendices

