The California Poverty Measure is a state-specific index of poverty, modeled on the Census Bureau's Supplemental Poverty Measure, that improves upon traditional poverty measures. Unlike traditional measures, the CPM accounts for necessary expenditures like child care and out-of-pocket health costs, adjusts for geographic differences in housing costs, and includes tax credits, food assistance, and other non-cash benefits in the resources available to help families meet basic needs. The CPM reveals which groups and local areas have the highest poverty rates and how California's safety net is, or is not, successfully reducing poverty. The CPM is jointly produced by the Stanford Center on Poverty and Inequality and the Public Policy Institute of California.
 Featured Report
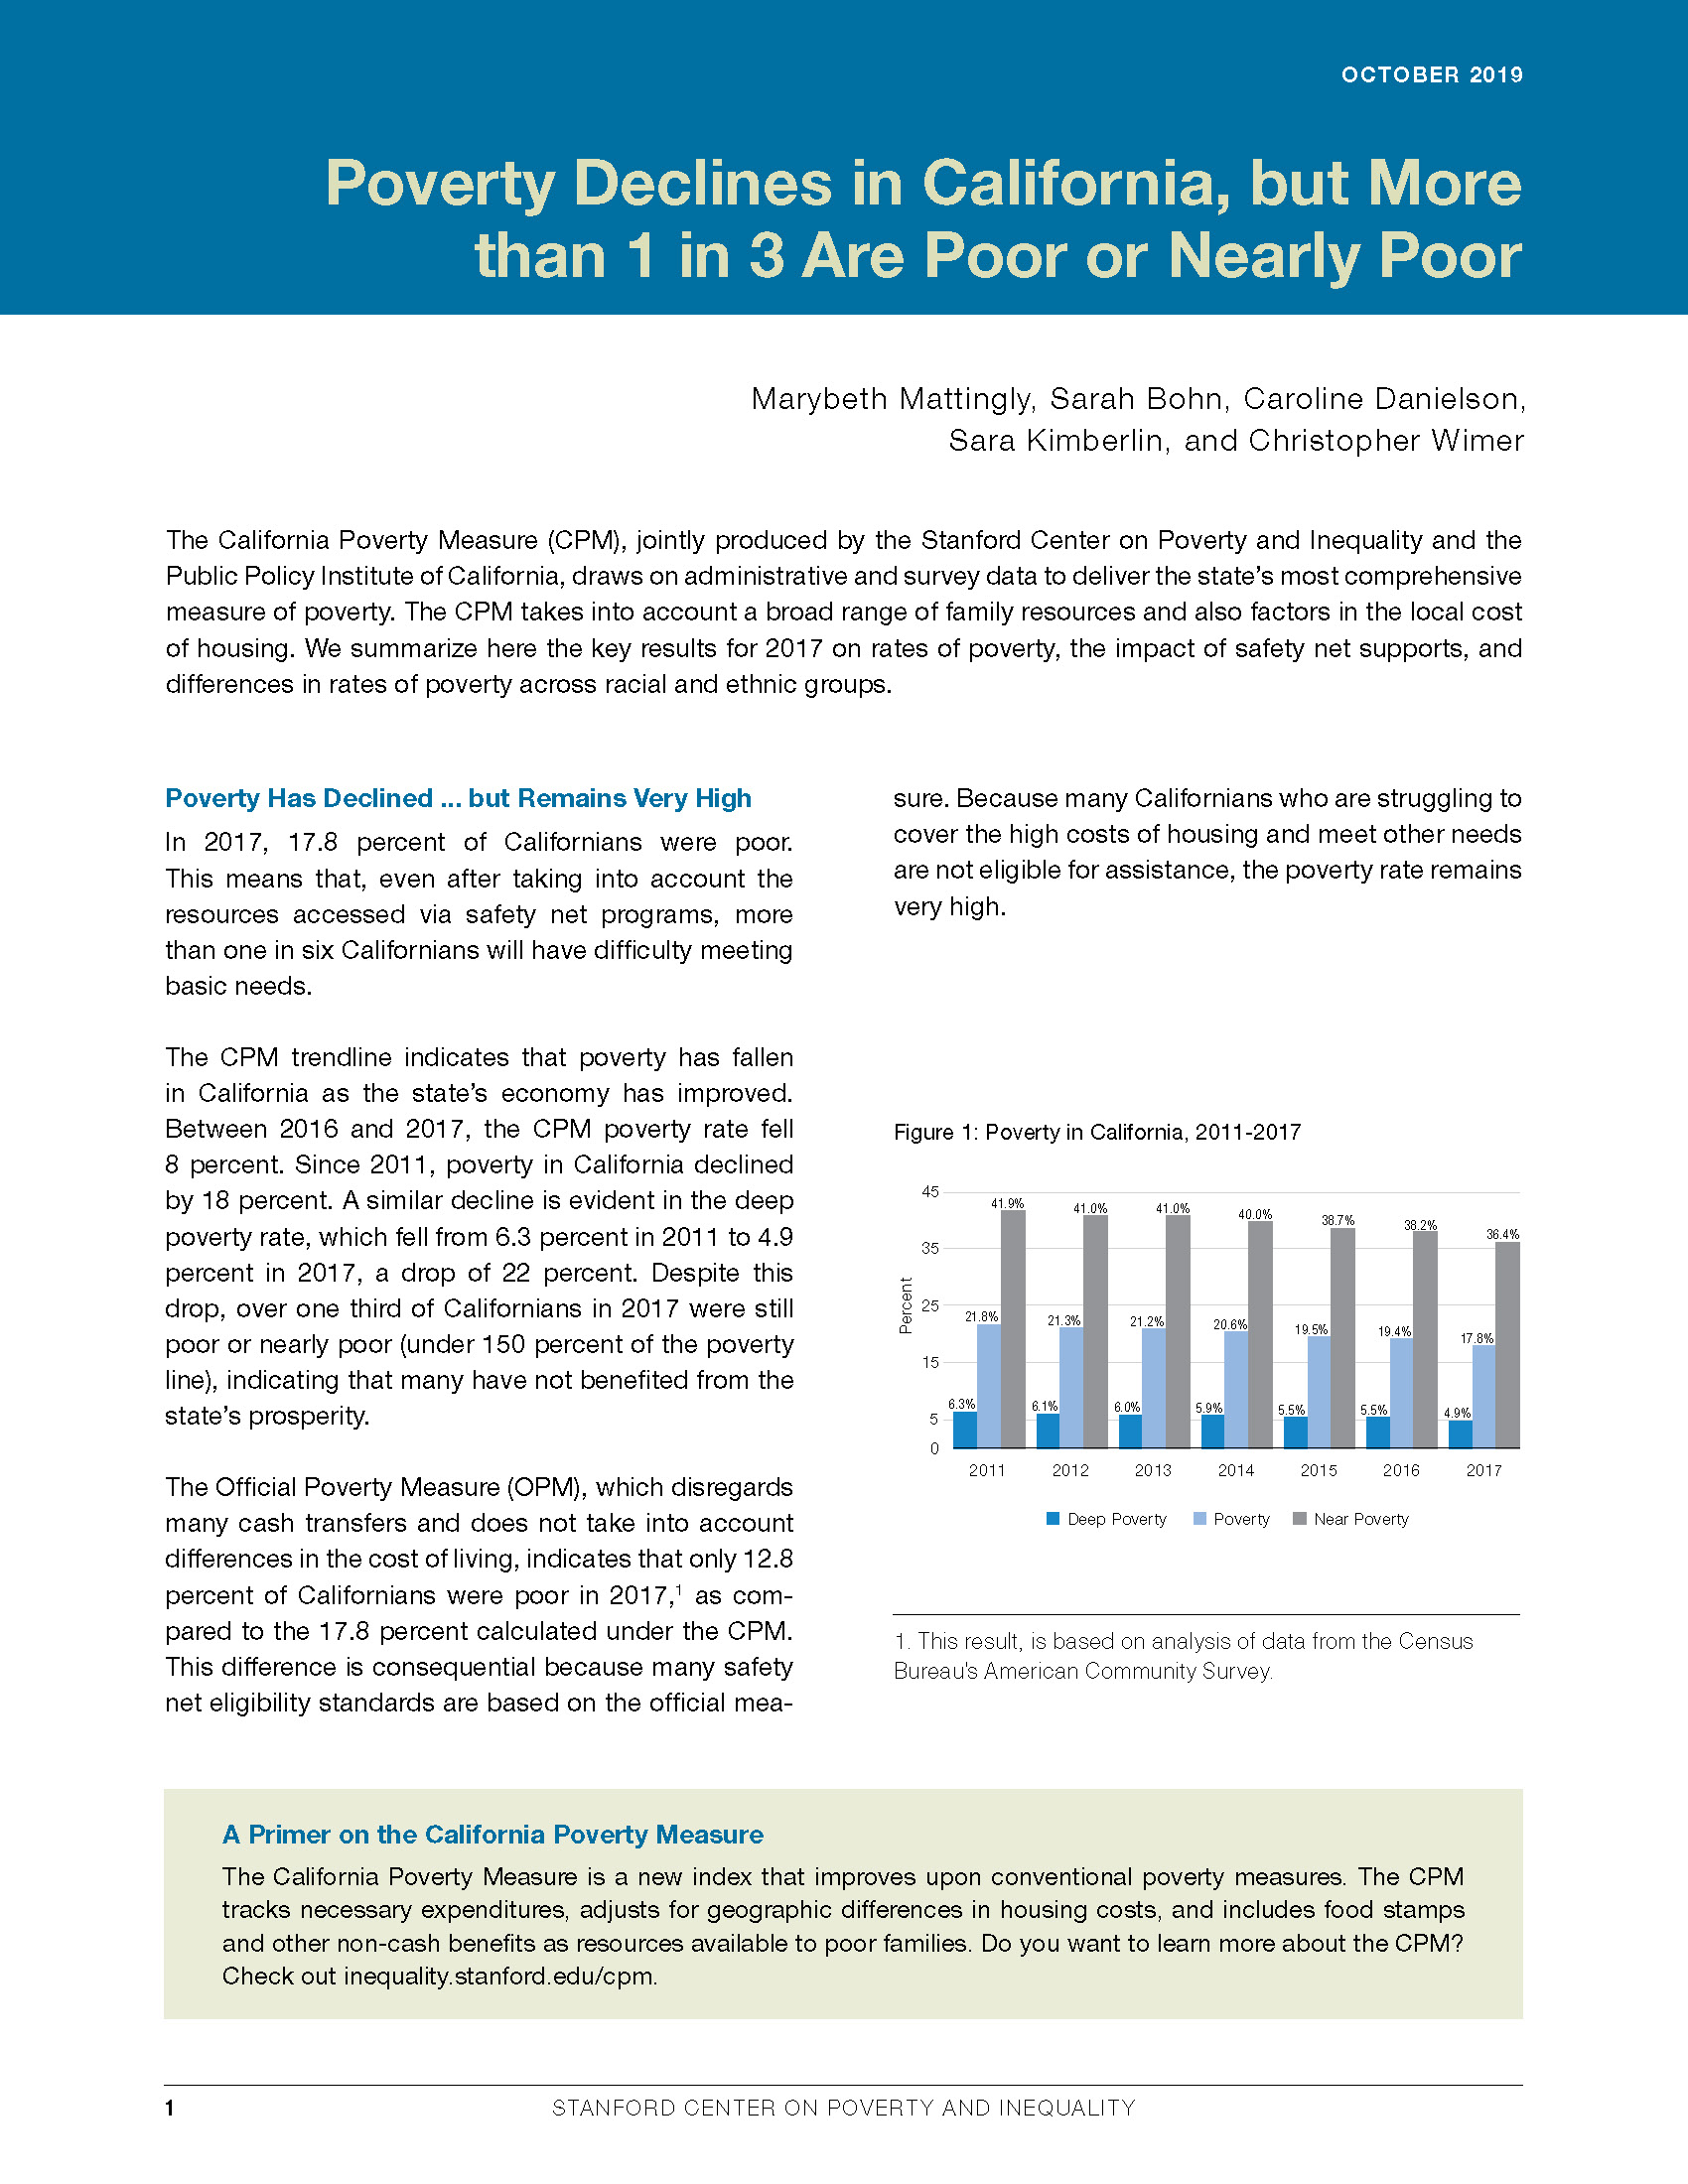
Poverty Declines in California, but More than 1 in 3 Are Poor or Nearly Poor
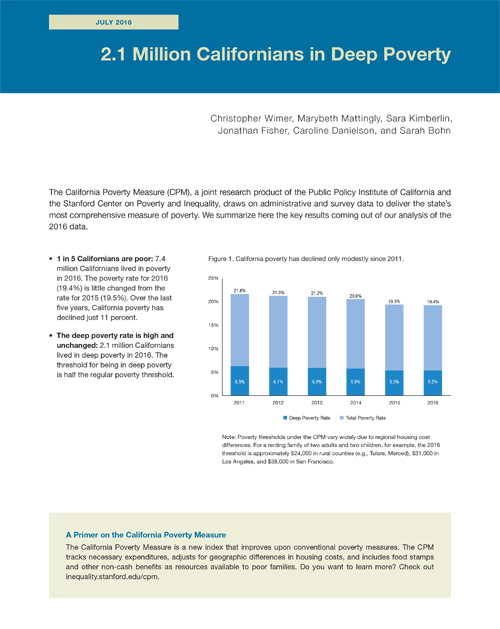
The California Poverty Measure (CPM) statistics for 2017 are now available! Jointly produced by CPI and the Public Policy Institute of California, the CPM draws on administrative and survey data to deliver the state’s most comprehensive measure of poverty. The data show that the poverty rate declined from 19.4% in 2016 to 17.8% in 2017. The deep poverty rate, which refers to the proportion of the population with family resources less than half of the poverty threshold, comes in at 4.9% in 2017.
- Read the brief (2021): In 2019, as the Economy Boomed, About 1 in 3 Californians Lived in Poverty or Near Poverty
- Read the brief (2021): More Than 1 in 3 Californians Lived in Poverty or Near Poverty in 2018
- Read the brief (2019): Poverty Declines in California, but More Than 1 in 3 Are Poor or Nearly Poor: 2017
- Read the brief (2018): 2.1 Million Californians in Deep Poverty: 2016
- Read the brief (2017): California’s Poverty Rate Goes Down, but 7.5 Million Remain Poor: 2015
- Read the brief (2018): Trends in California Poverty: 2011–2014
- Read the brief (2014): Poverty and Deep Poverty in California: 2012
- Read the brief (2013): A Portrait of Poverty within California Counties and Demographic Groups: 2011
- Read the report (2013): The California Poverty Measure: A New Look at the Social Safety Net
- View the methodology: The California Poverty Measure 2014: Technical Appendices
- View the methodology: The California Poverty Measure: 2012 Technical Appendices