Public safety net supports including nutrition assistance programs, cash benefits, and subsidized health insurance provide vital resources to help Californians with low incomes meet their basic needs. Data highlighted here include the number and race/ethnicity of local recipients of CalFresh and WIC food supports, CalWORKs cash benefits, and Medi-Cal health insurance, as well as the number of these recipients per 1,000 county residents, as a measure of where safety net programs currently have the largest population-level impact. Indicators of multi-program participation are also included.
Other indicators shown within this category include "estimated annual at-risk coverage rates" for CalFresh, WIC, and CalWORKs. Note that these at-risk coverage rates are distinct from many other published program take-up rates, participation rates, or program reach rates. These at-risk coverage rates aim to estimate the share and number of individuals receiving benefits at some point during the year, within the broader group who are at risk of having their monthly income fall low enough in one or more months to be eligible for benefits at some point during the year, even if their total annual income is more than 12 times the monthly income eligibility cutoff. Other published take-up rates typically aim to measure the share and number of individuals receiving benefits within the smaller group who have annual incomes so low (at less than 12 times the monthly income eligibility cutoff) that they would almost certainly be income-eligible for benefits. As a result, these at-risk coverage rates will by definition be lower than many other published program take-up rates. The broader group of at-risk individuals will include some individuals who do not actually fall into program eligibility during any months of the year, as well as some who are eligible at some point during the year but do not access benefits – yet all individuals in this broader at-risk group have incomes low enough that they may struggle to meet basic needs if they are not receiving safety net benefits.
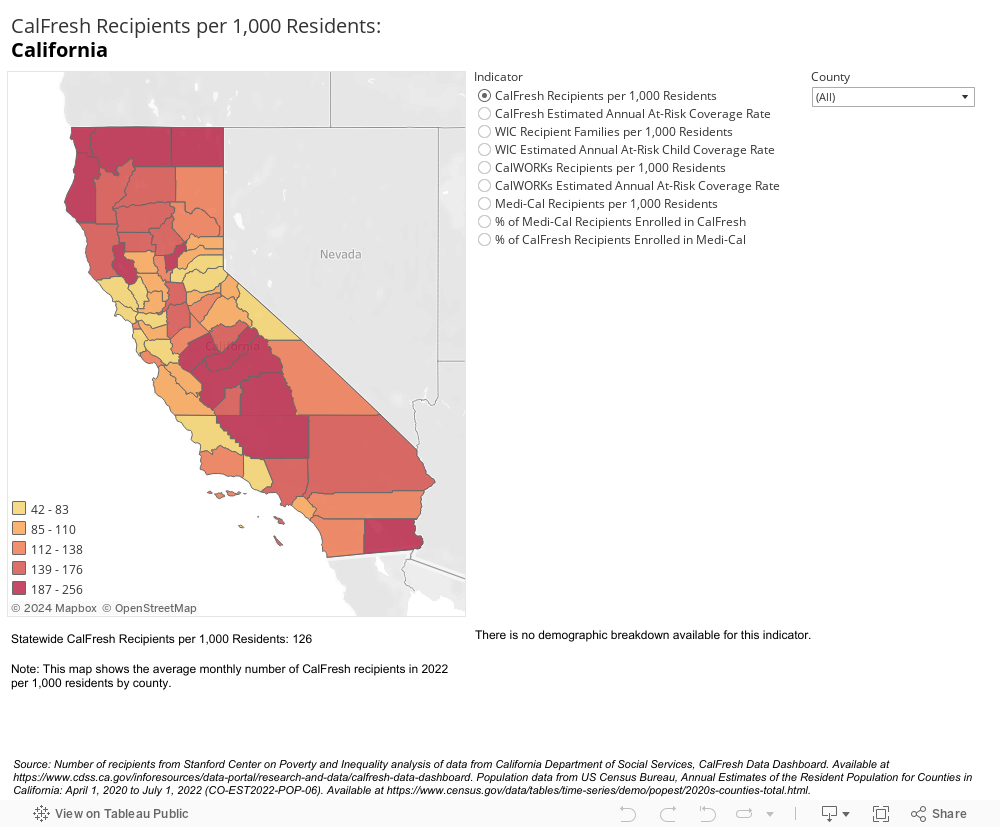
Note that CalFresh data presented here reflect enrollment while pandemic-linked SNAP Emergency Allotments and expanded college student eligibility remained in place, and Medi-Cal data reflect enrollment while pandemic-linked continuous coverage remained in place. These pandemic-era policies ended in 2023, so data are not yet available for a full year after their expiration.
A note about comparing county data points to each other, and to statewide data points: California’s 58 counties vary substantially in resident demographics, characteristics of local economies, tax base, community-based organization capacity, and local government administrative capacity. All of these factors can contribute to differences in outcomes across the indicators shown in the dashboard.
Also note that data points estimated from survey data include some uncertainty, reflected in the confidence intervals shown for these data points in the dashboard. Where confidence intervals on a particular indicator overlap for estimates for different counties, or for a county versus the statewide data point, these estimates are often not statistically significantly different from each other.